Tag Archives: climate

Patching up the ozone hole: The success of the Montreal Protocol
New model results show that the Antarctic ozone hole would have grown in size by 40% by 2013 if ozone depleting chemicals had not been banned in the 1980s.
CGS researchers at the University of Leeds’ School of Earth and Environment used computer models to determine the impacts of ozone damaging substances (ODSs) on the Earth’s ozone layer. They show that international efforts to control the release of ODSs has had a significant and measurable impact on reducing the size of the hole in the ozone layer.
The results from the study are published in Nature Communications.
The Montreal Protocol is regarded as one of the most important global treaties in history. The protocol was signed in 1987 with the aim to control the international use of ozone damaging substances. Without it, the researchers reveal that not only would the ozone hole over Antarctic be much bigger now but there would also be a significant hole over the Arctic region. The Arctic hole would have been large enough to affect much of northern Europe, including the UK. This ozone loss would have led to increases in surface ultraviolet radiation of up to 14% in the United Kingdom with a consequent increase in skin cancer and other related skin illnesses.
The new research simulated what the ozone hole would have been like today if nothing had been done. Lead researcher, Professor Martyn Chipperfield told the BBC: ”We would be living in an era of having regular Arctic ozone holes.”
Background
The ozone layer is a region of the Earth’s atmosphere that absorbs most of the sun’s harmful ultraviolet radiation. It contains higher amounts of ozone (O3) compared other parts of the atmosphere, hence the name.

False-color view of total ozone over the Antarctic pole on 23rd May 2015. The purple and blue colours are where there is the least ozone, and the yellows and reds are where there is more ozone.
Source: NASA
In the late 1970s scientists began to notice large holes appearing within the ozone layer over the Antarctic. The discovery of the annual depletion of ozone above the Antarctic was first announced by scientists at the British Antarctic Survey, in a paper which appeared in Nature, 1985. The cause of the depletion was linked to the use of chlorine, bromine and other chemical gases reaching the atmosphere. These were thought to be released from the extensive use of chlorofluorocarbons (CFCs) in business and industry during the 60s and 70s.
The discovery of the Antarctic ozone hole helped stimulate the signing in 1987 of the Montreal Protocol, an international treaty to limit production of chlorine-and bromine-containing ozone depleting substances.
The study concludes that, since the signing and enforcement of the Montreal Protocol levels of chlorine and bromine containing ozone depleting chemicals in the atmosphere have peaked and then declined. And this has resulted in a steady recovery of the holes in the ozone layer over the past two decades.
More information:
[1] Quantifying the ozone and ultraviolet benefits already achieved by the Montreal Protocol, Nature 2015
[2] CGS and Leeds researchers involved in the study:
– Professor Martyn Chipperfield
– Dr Sandip Dhomse
[3] http://www.nature.com/nature/journal/v315/n6016/abs/315207a0.html
[4] http://ozone.unep.org/new_site/en/montreal_protocol.php
[5] Regular NASA images of the Antarctic ozone hole: http://ozonewatch.gsfc.nasa.gov/
Tiny microbes on glaciers cause positive feedback for climate change
Tiny microbial activity on glaciers in the Arctic is reducing heat reflected back into the atmosphere. This effect has previously been overlooked but is expected to increase the effects of climate change in the polar regions.
Over the past few years Professor Liane G. Benning and PhD student Stefanie Lutz, members of the Cohen geochemistry research group in the School of Earth and Environment, have been busy making trips to Svalbard and Iceland to measure the ‘albedo’, the reflectivity, of glaciers and how microbial gardens might effect the amount of sunlight reflected by the glacier.
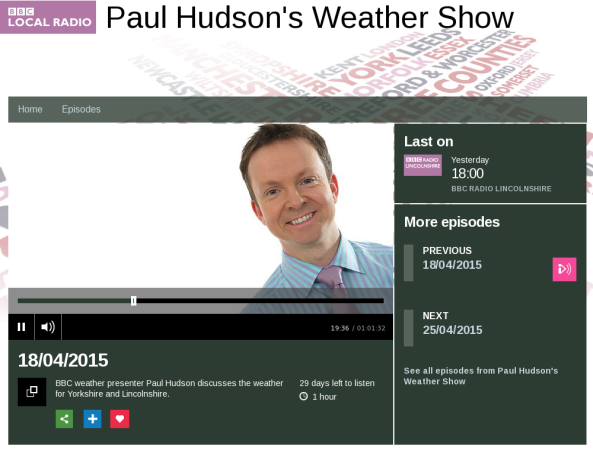
They discussed their recent trip to Svalbard with BBC’s Paul Hudson on his Weather Show radio channel. As well as talk about watching a solar eclipse from the the North, polar bear attacks, northern lights and news on a big new grant to study glaciers in Greenland!
President Obama on Climate Change
President Barack Obama in his 2015 State of the Union address highlighted the importance of tackling the climate change crisis.
NASA – A year in the life of Earth’s carbon dioxide
An ultra-high-resolution NASA computer model has given scientists a stunning new look at how carbon dioxide in the atmosphere travels around the globe.
Plumes of carbon dioxide in the simulation shift and swirl as winds disperse the greenhouse gas away from its sources, which are dominated by North American, European and East Asian centres.
The simulation also illustrates differences in carbon dioxide levels in the northern and southern hemispheres and distinct swings in global carbon dioxide concentrations as the growth cycle of plants and trees changes with the seasons.
The carbon dioxide visualisation was produced by a computer model called GEOS-5, created by scientists at NASA Goddard Space Flight Center’s Global Modeling and Assimilation Office.
Climate change in 15 seconds
Following on from our previous post explaining climate change in 18 tweets, here’s a video visualising climate change in 15 seconds.
What starts out as a happy blue planet in this NASA video quickly becomes an angry red one, with nine out of the 10 hottest years in recorded history all occurring in the new millennium.
Climate change in 18 tweets!
The latest IPCC report on climate change represents our most up to date understanding of the Earth’s climate, it’s changing behaviour and projections for the future.
CGS scientist Professor Piers Forster, one of the lead authors of the new synthesis report, has summarised the summary in just 18 tweets.
Map of what each country has promised at the climate summit
World leaders gathered yesterday for a crucial United Nations meeting to encourage 120 member states to sign up to a new comprehensive global climate agreement in Paris next year.
The last such meeting in 2009 ended with no concrete results. However the meeting yesterday was hailed by the United Nations Secretary General Ban Ki-moon, saying “never before have so many leaders gathered to commit to action on climate change”.
The interactive map below shows what each country has promised (source: mashable.com).
Note. This is not an exhaustive list of initiatives might be updated.
More information:
[1] http://mashable.com/2014/09/23/un-climate-summit-country-promises-map
[2] http://www.un.org/climatechange/summit/
[3] http://www.bbc.co.uk/news/world-29319363
Climate Change will Affect People, the Environment and Wildlife
Embed from Getty Images
The new IPCC Working Group 2 report, released today, says that climate change is real, it’s happening now and it’s affecting the lives and the livelihoods of people, as well as the planet. According to the report, climate change has already affected agriculture, human health, ecosystems on land and in the oceans and in our water supplies. These effects are global regardless of the wealth of a nation, its size or geographical location.
The report concludes that responding to climate change involves making choices about risks in a changing world.The nature of the risks of climate change is increasingly clear. The report identifies vulnerable people, industries, and ecosystems around the world. It finds that risk from a changing climate comes from vulnerability (lack of preparedness) and exposure (people or assets in harm’s way) overlapping with hazards (triggering climate events or trends). Each of these three components can be a target for smart actions to decrease risk.
Read more about the new IPCC report at: www.ipcc.ch
The Summary for Policy Makers can be downloaded here: http://ipcc-wg2.gov/AR5/images/uploads/IPCC_WG2AR5_SPM_Approved.pdf
Read more about the IPCC report from RealClimate at: www.realclimate.org/index.php/archives/2014/03/ipcc-wg2-report-now-out
2014: The Year for Climate Action
Only 6 months until the 2014 Climate Summit! Read more about the Summit at http://www.un.org/climatechange/ and let your voice be heard on Twitter using #Climate2014


