When continents collide: Active deformation and seismic hazard

Since 1900, 35 earthquakes worldwide have each killed at least 10,000 people. Of these, 26 were in the Alpine-Himalayan seismic belt – a broad “crumple zone” where the African, Arabian and Indian tectonic plates collide with Europe and Asia. Most of these deadly earthquakes were caused by the rupture of faults that had not previously been identified.

CGS scientist Tim Wright is Professor of Satellite Geodesy at the University of Leeds and Director of the Natural Environment Research Council’s Centre for the Observation and Modelling of Earthquakes, Volcanoes and Tectonics (COMET). His work has been at the forefront of developing the use of satellite radar for measuring tectonic and volcanic deformation.

Tim was recently invited to present a guest lecture at the Geological Society on his work trying to understand the nature of seismic hazard within the Alpine-Himalayan region.

You can follow Tim on twitter: @timwright_leeds

Nepal earthquake lowered Everest by up to 2.5 cm

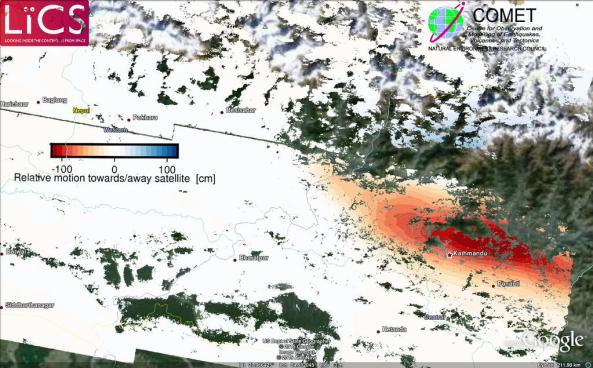
Further analysis of the newly processed sentinel-1 satellite radar data shows that the area around the Kathmandu region was uplifted in the earthquake, while the area to the north of Kathmandu sunk (subsided).

The red region in the image below shows uplift while the faint blues to the north indicate subsidence. Mount Everest is located to the northeast of Kathamndu.

Processed Sentinel 1 results of the Nepal earthquake deformation. red = mostly subsidence, blue = mostly uplift.  Source: Pablo Gonzalez – LiCS/COMET+

Processed Sentinel-1 results of the Nepal earthquake deformation. red = mostly uplift, blue = mostly subsidence.
Source: Pablo GonzalezLiCS/COMET+


The image was produced by COMET researchers at the University of Leeds as part of the Look Inside the Continents from Space (LiCS) project led by CGS scientist Professor Tim Wright.

New computer modelling results estimate that the amount of lowering experienced in the Everest region could be up to 2.5cm. These numbers are very preliminary and will be verified over the coming days with further research.

https://twitter.com/UNAVCO/status/593551340271378433

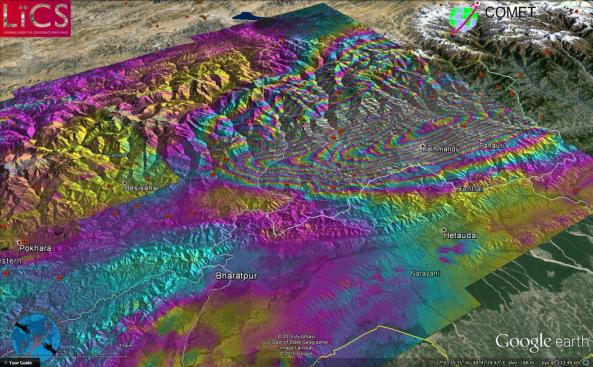
Clearer sentinel 1 image of Nepal earthquake deformation

A new clearer sentinel 1 satellite image has been produced by COMET researchers as part of the Look Inside the Continents from Space (LiCS) project led by CGS scientist Professor Tim Wright.

For Tim Wright’s preliminary interpretation of the results see our previous post.

Sentinel 1 image of the Nepal earthquake deformation. Source: John Elliot - LiCS/COMET

Sentinel 1 image of the Nepal earthquake deformation. 1 colour fringe = 10cm of ground deformation.
Source: John ElliotLiCS/COMET+

First Sentinel 1 satellite results for Nepal earthquake

The first coseismic sentinel 1 satellite results have now been processed by researchers in the InSARap project.

This slideshow requires JavaScript.

[edit] For a sharper image of the ground deformation see our latest post.

Tim Wright, CGS scientist and professor of satellite geodesy at the University of Leeds has provided a preliminary interpretation of the new results.

1. The earthquake ruptured East from the epicentre, confirming the observations from seismology.

2. Peak displacement is very close to Kathmandu; the fault under the city slipped significantly.

3. An area at least 120×50 km uplifted, with a maximum slip greater than 1m

4. The fault did not rupture the surface.

5. Area north of Kathmandu subsides. Consistent with elastic rebound from shallow thrust.
[CORRECTION]: The area around Kathmandu is uplifted in the earthquake

6. Overall, area at least 120 x100 km moved. Sentinel-1 data invaluable at this scale.

Disaster Charter activated for Villarrica volcano


A Red Alert has been declared in southern Chile after an eruption at Villarrica Volcano this morning.

Over two thousand people were evacuated from Pucon, and another thousand from Panguipulli, two communities close to the volcano.

While no one has been harmed in the eruption, the situation will continue to be monitored for any further eruption. The ash from the volcano could also pose a hazard to health. Meteorologists currently expect the ash cloud to be blown south and across remote parts of Argentina.

disaster_charterThe Disaster Charter is an agreement between international satellite and remote sensing agencies to provide free access to data and resources to help mitigate the effects of disasters on human life and property.

The Charter can be activated by any national disaster management authority. The activation for Villarrica was requested by the  Chilean agency responsible for civil protection (ONEMI, Oficina Nacional de Emergencia del Ministerio del Interior y Seguridad Pública).

For updates of the ongoing activity check the latest status reports from ONEMI, Chile. Also, follow #Villarrica on twitter for social media updates and more images of the current activity.

Monitoring earthquakes with radar satellites

From earthquakes and volcanoes to landslides and agriculture, radar satellites have revolutionised our ability to monitor the active processes changing the surface of the earth.

Radar satellite missions can measure millimetre-scale changes in Earth’s surface following an earthquake. On 24 August 2014, an earthquake struck California’s Napa Valley. By processing two images from the Sentinel-1A radar satellite, which were acquired on 7 August and 31 August 2014 over this wine-producing region, an ‘interferogram’ was generated showing ground deformation.

CGS researchers at the Leeds based Centre for the Observation and Modelling of Earthquakes, Volcanoes and Tectonics (COMET+) are at the forefront for using this technology to understand the active processes shaping the surface of the earth.

More information:
[1] http://www.esa.int/spaceinvideos/Videos/2015/02/Earthquake_monitoring_with_radar_satellites
[2] http://www.esa.int/Our_Activities/Observing_the_Earth/Copernicus/Sentinel-1/Radar_vision_maps_Napa_Valley_earthquake
[3] http://www.see.leeds.ac.uk/research/igt/research-projects/looking-inside-the-continents-of-space/

Planet Earth: The highest resolution timelapse of Earth ever created

This is the highest resolution video of our planet ever created. The animation shows the Earth from May 15th ato May 19th, 2011. It was created using images from the Russian geostationary Elektro-L weather satellite.

James Tyrwhitt-Drake from the University of Victoria in Canada used these images to create a super high definition 4K timelapse video of our planet. It’s pretty amazing!

P.s. Be sure to set the resolution to highest setting in the video.

Demonstration of a tropospheric correction for Sentinel 1a

David BekaertDavid Bekaert is a PhD student based in the School of Earth and Environment at the University of Leeds. David’s research involves using space based remote sensing technologies and atmospheric corrections for the detection of small magnitude ground movements. In this guest blog, David provides some technical details showing how weather models can be used to estimate the scale of atmospheric delays in the new European Space Agency‘s Sentinel 1a satellite radar data.

Sentinel 1a is a C-band Synthetic Aperture Radar with a repeat acquisition rate of 12 days. In combination with Sentinel 1b (estimated launch in 2016), the acquisition rate will decrease to 6 days (click here for more Sentinel 1 information). This high repeat rate together with the large illuminated tracks (200 km wide) make the Sentinel 1 constellation an attractive source of data to study the cryosphere and solid earth.

An example Sentinel 1 interferogram over Italy is shown in Figure 1a (by NORUT and PPO.Labs, see http://insarap.org). This data is not continuous, but wrapped, were each color cycle represents 2.6 cm of displacement in the radar line of sight (LOS). Unwrapping this correctly and the correction for tropospheric artefacts are two of the main challenges within the InSAR community.

Sentinel1a_Italy_APS

A) Sentinel 1a IW interferogram over Italy. Copyright by NORUT and PPO.labs (http://insarap.org), as part of ESA InSARap using Copernicus data. B) Our estimated tropospheric correction using the 75 km ERA-I weather model product. Courtesy of Bekaert David. ERA-I data were provided by ECMWF. Each color cycle represents 2.6 cm displacement in the radar line of sight (LOS).

The high Sentinel 1 repeat rate does not necessary implies smaller atmospheric signals, as the atmosphere varies from day to day, and in space. In Figure 1b we demonstrate that the tropospheric correction estimated from the ERA-I (75 km) weather model outputs, from the European Centre for Medium- Range Weather Forecasts (ECMWF), shows promising results in reducing tropospheric arctifacts over a large region as imaged by Sentinel 1a. We find good agreement between the Sentinel 1a interferogram A) and our estimated tropospheric delay B) (e.g north-east region, south-west region, the volcanoes Etna and Vesuvius, and other locations).

In general we find that the weather model is capable of estimating the long-wavelength features well. While the weather model is capable of estimating the magnitudes correctly, the timing and thus location in space might be off. The problem of the troposphere will be further reduced in future, with a longer time-series of sentinel 1 acquisitions. These long-term observations together with tropospheric corrections will allow us to detect smaller magnitude surface deformations.

More Information:
[1] More of David’s research on his website: http://davidbekaert.com
[2] http://www.see.leeds.ac.uk/people/d.bekaert

Using satellites to map ground movements on Fogo volcano

The Fogo volcano, named after the Cape Verde island it inhabits, erupted on 23rd November for the first time in 19 years. Initial analysis suggests that there was little warning from the volcano before the eruption and surprised many local residents. The volcano is still currently active and the locals have been evacuated.

The volcano expelled a large quantity of lava which flowed towards a nearby village. About 20 homes were destroyed

Researchers at the University of Leeds, School of Earth and Environment (Pablo Gonzalez) and PPO.labs (Petar Marincovic) in the Netherlands have been busy analysing satellite radar data from the European Space Agency’s new Sentinel-1A satellite, which launched earlier this year in April.

Preliminary results show the movement of the ground on and around the volcano shown by the rainbow colours on the radar deformation map shown below.

Surface deformation map of the Fogo island volcano that erupted recently.  Source: ESA

Surface deformation map of the Fogo island volcano that erupted recently.
Source: ESA

The use of satellites, such as Sentinel-1A, will allow for a much greater number of volcanoes to be monitored on a regular basis. This is particularly valuable in places with few sensors on the ground. The data acquisition rates are expected to increase further with the launch of the next suite of Sentinel satellites from the European Space agency over the next few years.

“By acquiring regular images from Sentinel-1, we will be able to monitor magma movement in the subsurface, even before eruptions take place, and use the data to provide warnings,” said Tim Wright from the University of Leeds and director of the UK Natural Environment Research Council’s Centre for the Observation and Modelling of Earthquakes, Volcanoes and Tectonics. (quote source)

“The coverage and repeat visit time of Sentinel-1 is unprecedented and we are currently working on a system that will use Sentinel-1 to monitor all of the visible volcanoes in the world,” said Andy Hooper, also from the University of Leeds. (quote source)

More information:
[1] http://www.esa.int/Our_Activities/Observing_the_Earth/Copernicus/Sentinel-1/Fogo_volcano_on_Sentinel_s_radar
[2] http://www.esa.int/spaceinimages/Images/2014/12/Mapping_for_emergency_response
[3] http://www.esa.int/spaceinimages/Images/2014/12/Sentinel-1_maps_Fogo_eruption
[4] http://www.bbc.co.uk/news/world-africa-30291041

National Earth Observation Centres move to Leeds

The Centre for the Observation and Modelling of Earthquakes, Volcanoes and Tectonics (COMET) and the Centre for Polar Observation and Modelling (CPOM) moved to the School of Earth and Environment, University of Leeds this month. The centres will receive over £5 million in core Natural Environment Research Council (NERC) funding over the next 5 years.

COMET, directed by CGS academic Prof. Tim Wright and including scientists from Leeds, Oxford, Cambridge, Reading, UCL, Bristol and Glasgow, exploits satellite data to model tectonic and volcanic processes.

CPOM, directed by Prof. Andy Shepherd and including scientists from Leeds, UCL, Bristol and Reading, measures changes to ice sheets and glaciers in order to study the impacts of climate change.

Both centres will analyse data from the recently launched European Space Agency Sentinel-1A satellite, which allows detection of millimetre-scale changes to the Earth’s surface.

Professor Tim Wright said: “Today’s changes mark a new chapter in the history of CPOM and COMET. It presents a golden opportunity for the scientific community to better exploit the growing volume of data collected by satellite sensors, placing the University of Leeds at the heart of the government’s strategy to drive economic growth through investment in space technologies.”

Ekbal

Read the detailed article on the CGS website by clicking here.