This is the first of two blogs on satellite Earth Observation. This article will focus on what can be achieved with this technology and the next will be on the strengths the University of Leeds’ School of Earth and Environment has in this field.
Recently I had the great opportunity to attend the European Space Agency (ESA)’s Living Planet Conference held this year in the historic city of Edinburgh. The conference brought together over 1900 people from all over the world with the common aim to share knowledge and expertise on how we use satellite earth observation data (particularly from European satellites) to better understand the world we live on.
In his talk at the plenary session ESA’s Director General Jean-Jacques Dordain pointed out that Earth Observation is by far the largest programme for ESA in terms of budget and that it is the scientists that fundamentally drive these missions.

Satellite radar map of part of the Virunga Mountains, East Africa. The colours can be used to determine the actively deforming regions.
(ESA)
Earth observer satellites play a pivotal role in providing data to better understand a multitude of 21st century societal challenges including but not limited to:
– Population growth and migration
– Food production and land use
– Energy
– Geohazards
– Climate change
– Weather, sea level and ocean currents
– Earth’s changing surface
– The Earth’s biomass
– The geomagnetic field and space weather
Rather than go into a lengthy discussion of all of these I will focus on how Earth observation has helped us to better understand geohazards and our climate.
The early satellites such as ERS-1 (1991), ERS-2 (1995) and ENVISAT (2002) paved the way for the satellite geodesy age. They’re almost two decades of constant monitoring of the Earth has provided a wealth of data for the scientific community which has been instrumental to improving our understanding of natural (and human induced) hazardous events. Even now, long after these satellites have been decommissioned, the archived data is used for ongoing research.
![Synthetic interferogram for the 2003 Bam earthquake. The coloured fringes are essential contours of displacement during the earthquake. Source [1]](https://climateandgeohazards.files.wordpress.com/2013/09/bam-talebian.png?w=250&h=270)
Synthetic interferogram for the 2003 Bam earthquake. The coloured fringes are essentially contours of displacement during the earthquake.
Source [1]
The extent of deformation from earthquake ruptures, for example, can often be misinterpreted from limited spatial data such as GPS and ground surveys. These satellites provided a means to determine the deformation from these events on large scales and at a high spatial resolution. Such studies led to the use of this data to measure the much smaller interseismic signals and the build-up of strain energy on locked faults. Even if these faults are not obvious in the landscape.
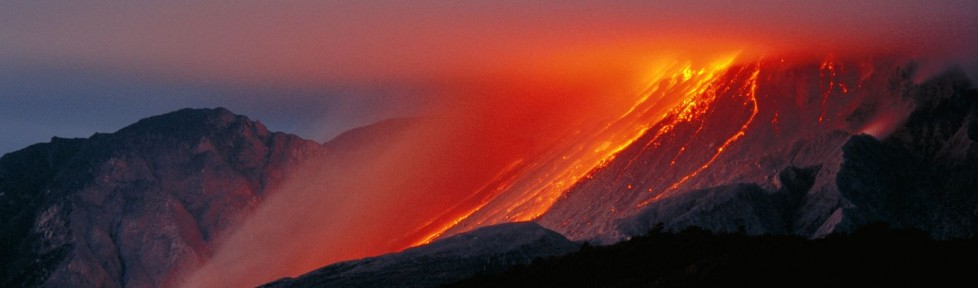
Parallel to this is the geodetic work to monitor active volcanoes. Satellite radar can be used to monitor to the uplift and subsidence of volcanoes which can be interpreted as inflation and deflation caused by the presence of magma. Such monitoring aided in providing early warning before the 2010 eruption of Mt Merapi in Indonesia and helped save thousands of lives.
The extent of floods and the potential for future flooding in a particular region can be assessed using space based geodetic monitoring. The location of landslides and the variation of surface motion can be monitored to determine the stability and likelihood that a landslide may be triggered by an incoming hurricane (which is also monitored using space based instruments).
Various gas concentrations (e.g. carbon-dioxide, sulphur dioxide, methane) in the atmosphere can be determined and their effects on the local and global climate studied. Such measurements are integral in adding boundary conditions to climate models which improve our estimates of the future effects of greenhouse gas emissions. Accurate weather reports rely on real-time satellite measurements of atmospheric pressure, humidity, temperature etc.
Sentinel-1, due to be launched early next year, will be the first dedicated Earth observation satellite for interferometry (i.e. mapping changes through time). Its long mission duration and systematic acquisitions will enable scientists to better understand the changing nature of the Earth’s surface through time. Such acquisitions will, for example, allow near-real time monitoring of volcanoes and and thus enable better and more accurate forecasting before these events. Also the detection of slow strain accumulation on large hazardous faults will be possible with only a few years worth of data.

Sentinel-1, due to be launched in march 2014.
(ESA)
Four more Sentinel missions are planned for future years covering all the Earth observation topics such as biomass, sea level, atmospherics and land cover. ESA’s Open Access data policy also enables free access to all its mission data for both scientific and commercial use.
The next few years will certainly result in much greater efforts at understanding the workings of our little blue planet because after all, there is no alternative to planet Earth; we are here to stay.
Ekbal
More information:
[1] Talebian et al., The 2003 Bam (Iran) earthquake: Rupture of a blind strike-slip fault, 2004, Geophysical Research Letters, vol. 31, L11611, doi:10.1029/2004GL020058
[2] http://www.esa.int/Our_Activities/Observing_the_Earth


![Synthetic interferogram for the 2003 Bam earthquake. The coloured fringes are essential contours of displacement during the earthquake. Source [1]](https://climateandgeohazards.files.wordpress.com/2013/09/bam-talebian.png)

